WHO landscape of clinical trials on monoclonal antibodies
Published: January 2025
What you see | Scope, analysis and limitations | Data sources
What you see
The data visualization allows filtering for
- The recruitment status of trials
- Disease or condition targeted by the trial (infectious diseases, malignant neoplasms or cancer, and immune targets)
- Year of trial registration
- Decade of trial registration
The data visualization shows the:
Number of trials by:
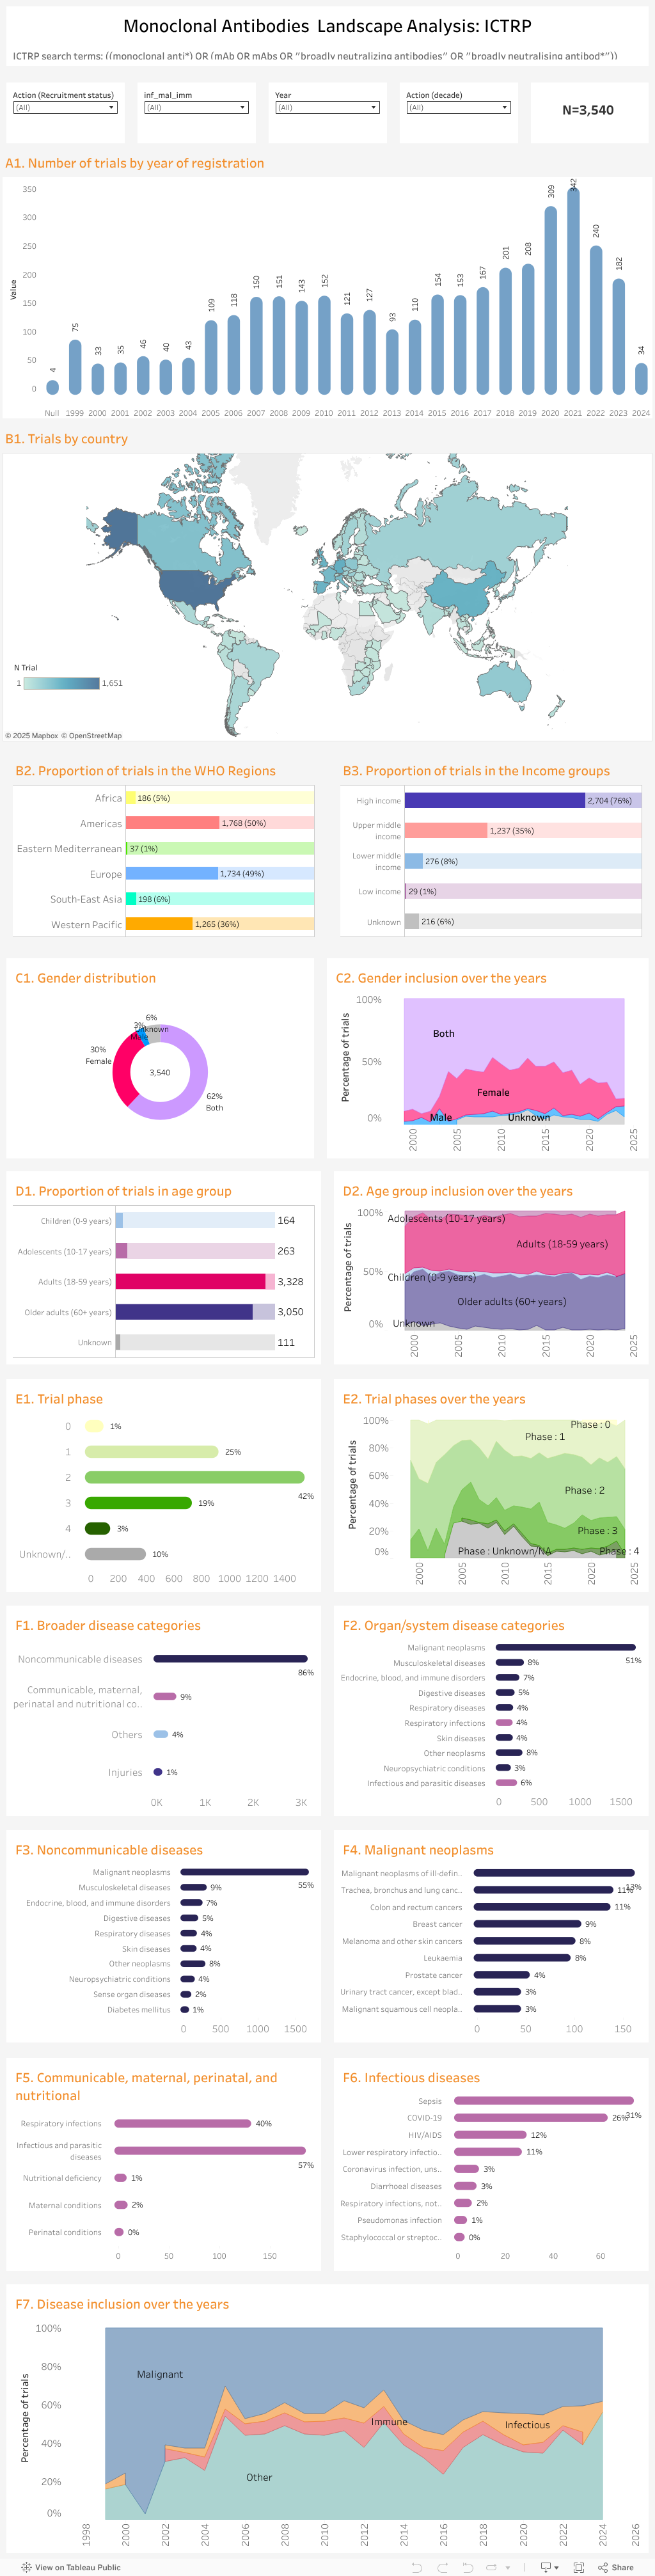
- Year of trial registration (chart A.1)
- Country in which the trial is taking place (map B.1)
- WHO Region in which the trial is taking place (chart B.2)
- Income group of the country in which the trial is taking place (chart B.3)
- Gender distribution of trial inclusion criteria in total (chart C.1)
- Gender inclusion of trial inclusion criteria by year of registration (chart C.2)
- Number of trials including different age groups (chart D.1, hover over bar to see % of trials including the age group)
- Age group inclusion by year of registration (chart D.2)
- Phase of trial (chart E.1)
- Phase of trial by year of registration (chart E.2)
Disease or condition focus of trials by:
- High level categories (chart F.1)
- Organ or system categories (chart F.2)
- Focus on non-communicable diseases (chart F.3)
- Focus on malignant neoplasms (chart F.4)
- Focus on communicable, maternal, perinatal and nutritional diseases and conditions (chart F.5)
- Focus on infectious diseases (chart F.6)
- Disease focus by year of registration of malignant, infectious and immune targets (chart F.7)
Note: A clinical trial can be conducted in multiple locations and each trial is counted once per country; therefore, the numbers displayed in these charts may total to more than the total number of trials.
Points to note
Number of trials on monoclonal antibodies (mAbs) peaked in 2021 with 342 trials regsitered (see Chart A.1). In the decade 2004-2013 1,207 trials were conducted on mAbs, while in 2014-2023 2,066 trials were conducted (filter Action (decade) and see number N).
Most trials are conducted in the United States of America (see map B.1). Of infectious disease trials 75% occur in high income countries (select filter at top for Infectious and read chart B.3).
In low income countries there have been 29 mAb trials registered (select in Chart B.3) the majority of which are on infectious and parasitic diseases (10, 36%; Chart F.2).
Trials in South-East Asia have been predominantly phase 3 (57%) and 83% of trials have been on noncommunicable diseases with 62/198 trials on malignant neoplasms (select South-East Asia in B.2 and read values in E1 and F1). In infectious diseases the primary target was sepsis (25% of trials, see chart F.6).
Since 2018 the number of trials focused on infectious disease targets has increased (reset page using curved arrow at bottom of visualization and see chart F7).
To explore the data further
- Select a specific region (chart B.2) or any other specific element or combination of elements to display the corresponding data in the other charts.
- Hold the ‘Ctrl’ key on your keyboard to select more than one option.
- Hover the cursor on a bar or a cell in a table to see more information in a pop-up window.
- Undo a selection by clicking ‘undo’ or ‘reset’ near the bottom of the page or by clicking the same element again.
Scope, analysis and limitations of the data
Scope
- Our analysis covers clinical trials on monoclonal antibodies registered in a clinical trial registry which contributes data to ICTRP from 1999 to 2023.
Analysis
- The analysis leverages data from the WHO's International Clinical Trials Registry Platform (WHO ICTRP).
- The data presented in this visualization utilizes classifications that are not mutually exclusive. For example, a registered trial can recruit participants from multiple countries and regions. In this case, the trial will be counted once per region in chart B.2 but once per income level in chart B.3. The total number of trials across the two charts is therefore not equivalent.
Limitations of the data
- Automated data mining was used to generate information on the primary disease investigated in each trial using text-based data fields.
- A list of disease synonyms was compiled using as a base the Unified Medical Language System (UMLS). This was complemented by synonyms drawn from the data, mostly to account for errors in data entry such as spelling errors or use of abbreviations.
- An automated algorithm was applied to two data fields using the list of disease synonyms to generate the uniform disease classification field used in this analysis. The first field is a based on free-text keywords provided by the registrant. The second is the scientific title of the trial. If the first field provided a match the second was not used.
- The first match closer to the beginning of the text field was selected. This was considered the primary disease investigated by the trial. It is possible that the trial has more than one disease focus, which is not captured in this analysis.
- The algorithm was refined through various iterations but as with any automated algorithm, it is likely that some trials were not correctly matched.