Distribution of R&D funding flows for neglected diseases (G-FINDER), by country, funder, and recipient organizations
Published: July 2017
The product-related R&D funding flows for neglected diseases, and select viral haemorrhagic fevers (VHFs) are collected from the Policy Cures Research G-FINDER survey. This collects funding data from over 200 private, public and philanthropic organizations on product-related R&D and basic research and platform technology investments in 39 neglected diseases and select VHFs.
See also:
What you see | Scope and limitations | Data sources | Current version
What you see
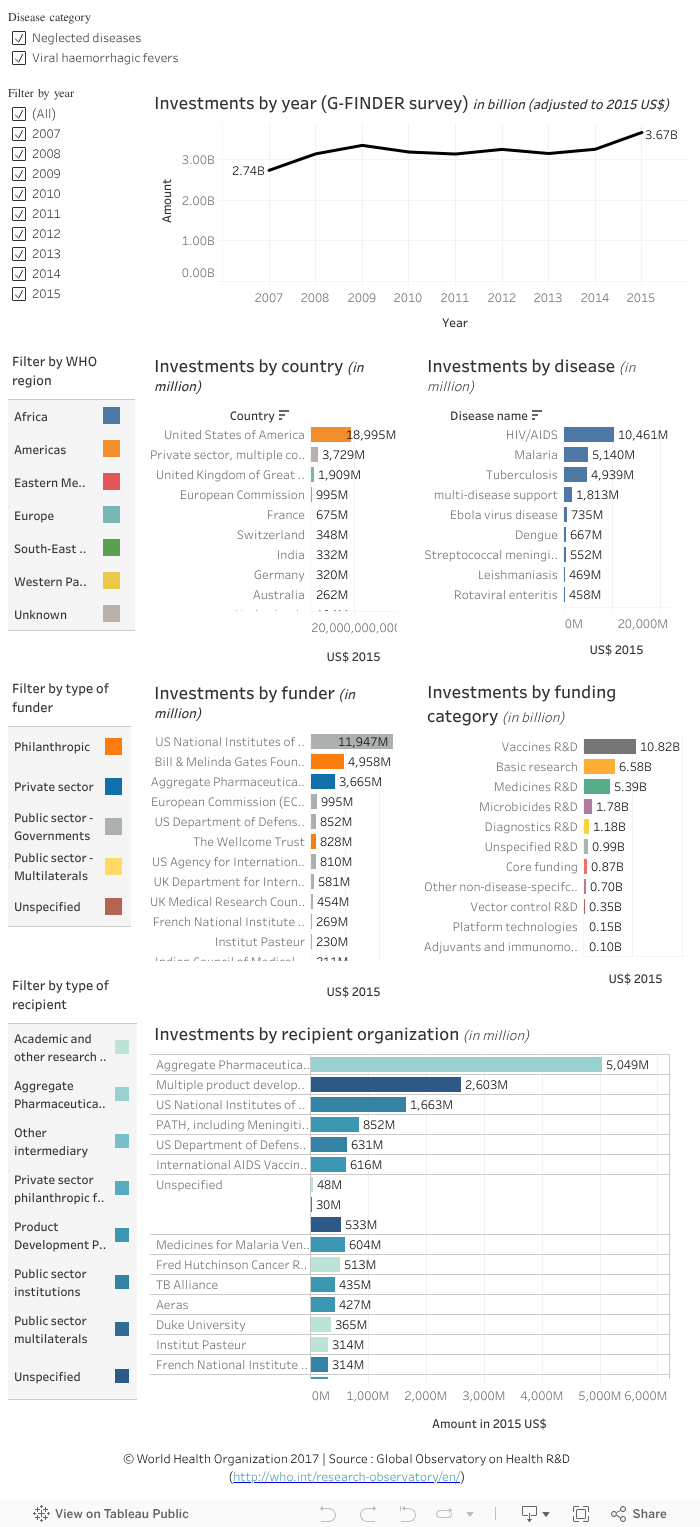
The data visualization illustrates the trend in investments for neglected diseases and select VHFs from 2007-2015 (top chart), their distribution by funder country (second chart, left), disease (second chart, right), funder organization (third chart, left), funding category (third chart, right) and recipient organization (bottom chart) (note: data on VHFs are available from 2014 only for Ebola virus disease and for 2015 for the other select VHFs, see list under scope below). The data in the years prior to 2015 are adjusted for inflation and presented in US$ 2015 (adjustment performed by the data source).
Data can be filtered by disease category (neglected diseases or VHFs), year, WHO Region, type of funder or recipients by selecting the relevant category (or more than one) from the tick-box or legend key on the left side of the visualization.
Points to note:
- The G-FINDER survey data underestimate the total R&D investments for these diseases as reporting is incomplete and need to be interpreted cautiously due to the scope restrictions of the survey (outlined below).
- The reported funding flows by country exclude investments by the private sector, which is reported separately in an aggregate form (referred to as “private sector, multiple countries” in the country list). Therefore, the total investments by country only represent public and philanthropic sources in those countries.
- Over the nine years of investments on neglected diseases (un-tick the ‘Viral haemorrhagic fevers’ disease category on the top left to filter):
-- United States of America contributed more than half (US$ 18.6 billion) of the total investments on neglected diseases from public and philanthropic sources, followed by the United Kingdom of Great Britain and Northern Ireland (US$ 1.9 billion). Investments by the private sector (referred to as “private sector, multiple countries” on the country list) were a total of US$ 3.4 billion (second chart, left).
-- HIV/AIDS received the highest investments, followed by malaria and tuberculosis (US$ 10.5, 5.1, and 4.9 respectively; second chart, right). However, funding for HIV/AIDS showed a decline from US$ 1.2 billion in 2012 to US$ 1.0 billion in 2015, while funding for tuberculosis showed an upward trend over the same period, from US$ 0.5 billion in 2012 to US$ 0.6 billion in 2015 (click on each disease name in the second chart -right to see the annual trend illustrated in the top chart).
-- The top funder was from the public sector, i.e. the United States of America’s National Institutes of Health (NIH), followed by a philanthropic organization, the Bill & Melinda Gates Foundation and the private sector (aggregate pharmaceutical and biotechnology companies) (US$ 11.8, 4.9 and 3.4 billion respectively; third chart, left).
-- The highest amounts of funding were for vaccines R&D, followed by basic research and medicines R&D (US$ 10.4, 6.5 and 5.2 billion respectively; third chart, right).
-- The United States of America’s National Institutes of Health (NIH) represented the highest share (6%) of total investments by a recipient institution (98% was through self-funding, click on the institution name in the bottom chart to see its funders in the third chart –left and other relevant information in the other charts), followed by PATH (3%) (bottom chart). - On the other hand, over the two years with data on investments on VHFs (un-tick ‘neglected diseases’ on the top left to filter):
-- In contrast with the general trend for neglected diseases, funding flows for VHFs increased from US$ 0.2 billion in 2014 to US$ 0.6 billion in 2015 (top chart).
-- As shown in the second chart –left, the United States of America contributed more than half of the funds (US$ 0.4 billion), followed by the private sector (in multiple countries) (US$ 0.3 billion) and the European Commission (US$ 0.05 billion).
-- Over 90% of the funding (US$ 0.7 billion) was for Ebola virus disease (second chart, right).
-- Public sector - Governments and Multilaterals account for almost two thirds of the total investments on VHFs (hold the Ctrl key and click on Public sector - Governments and Public sector – Multilaterals on the left side column to filter), with the highest funding from the United States of America’s National Institutes of Health (NIH), followed by United States of America’s Biomedical Advanced Research and Development Authority (BARDA), and the US Department of Defense (DOD) (US$ 0.2, 0.1, and 0.1 billion respectively; third chart, left ).
-- As shown in the third chart -right, around half of the investments were for vaccines R&D (US$ 0.5 billion), followed by medicines R&D (US$ 0.2 billion) and basic research (US$ 0.1 billion).
Scope and limitations
The data must be interpreted cautiously because of the specific scope restrictions of the G-FINDER survey (see link below for detail). The scope of the G-FINDER survey is determined by applying the following three criteria for neglected diseases. (R&D investments which do not meet these criteria are excluded.)
- The disease disproportionately affects people in developing countries.
- There is a need for new products (i.e. there is either no existing product, or improved or additional products are needed).
- There is market failure in developing these new products (i.e. there is an insufficient commercial market to attract R&D by private industry).
For some diseases, only R&D funding for developing-country specific serotypes/strains or products are included. For example, genotypes 4, 5, and 6 only are included for Hepatitis C. R&D funding flows for VHFs included Ebola virus disease only since 2014 with the addition of Marburg virus disease, Lassa fever, Rift Valley fever and Crimean-Congo haemorrhagic fever in 2015.
In addition, the funding data from industry is only available in an aggregated form. This means that funding levels by funder, funding category and other breakdowns substantially underestimate the actual investments in these categories . Data from the private sector (pharmaceutical and biotechnology companies) are presented separately as aggregate pharmaceuticals within the scope of G-FINDER and in the data visualization above.
G-FINDER scope and restrictions
To explore the data further:
- Filter data by disease category, year, WHO Region, type of funder or recipients by selecting the relevant category (or more than one) from the tick-box or legend key on the left side of the visualization.
- Hover the cursor through the line on the top chart or on a bar in a graphic to see more information in a popup window.
- Undo a selection by clicking ‘undo’ or ‘reset’ near the bottom of the page or by clicking the same element again.