Distribution of R&D funding flows for neglected diseases by country, funder, and recipient organizations
Published: April 2020
The product-related R&D funding flows for neglected diseases are collected from the Policy Cures Research G-FINDER survey. For 2018, funding data were collected from 262 private, public and philanthropic organizations, on all types of product-related R&D, basic research and platform technology investments covering 36 neglected diseases. (Note: Disease names used here have been reclassified; see the classifications and standards section for the rationale and approach).
See also:
What you see
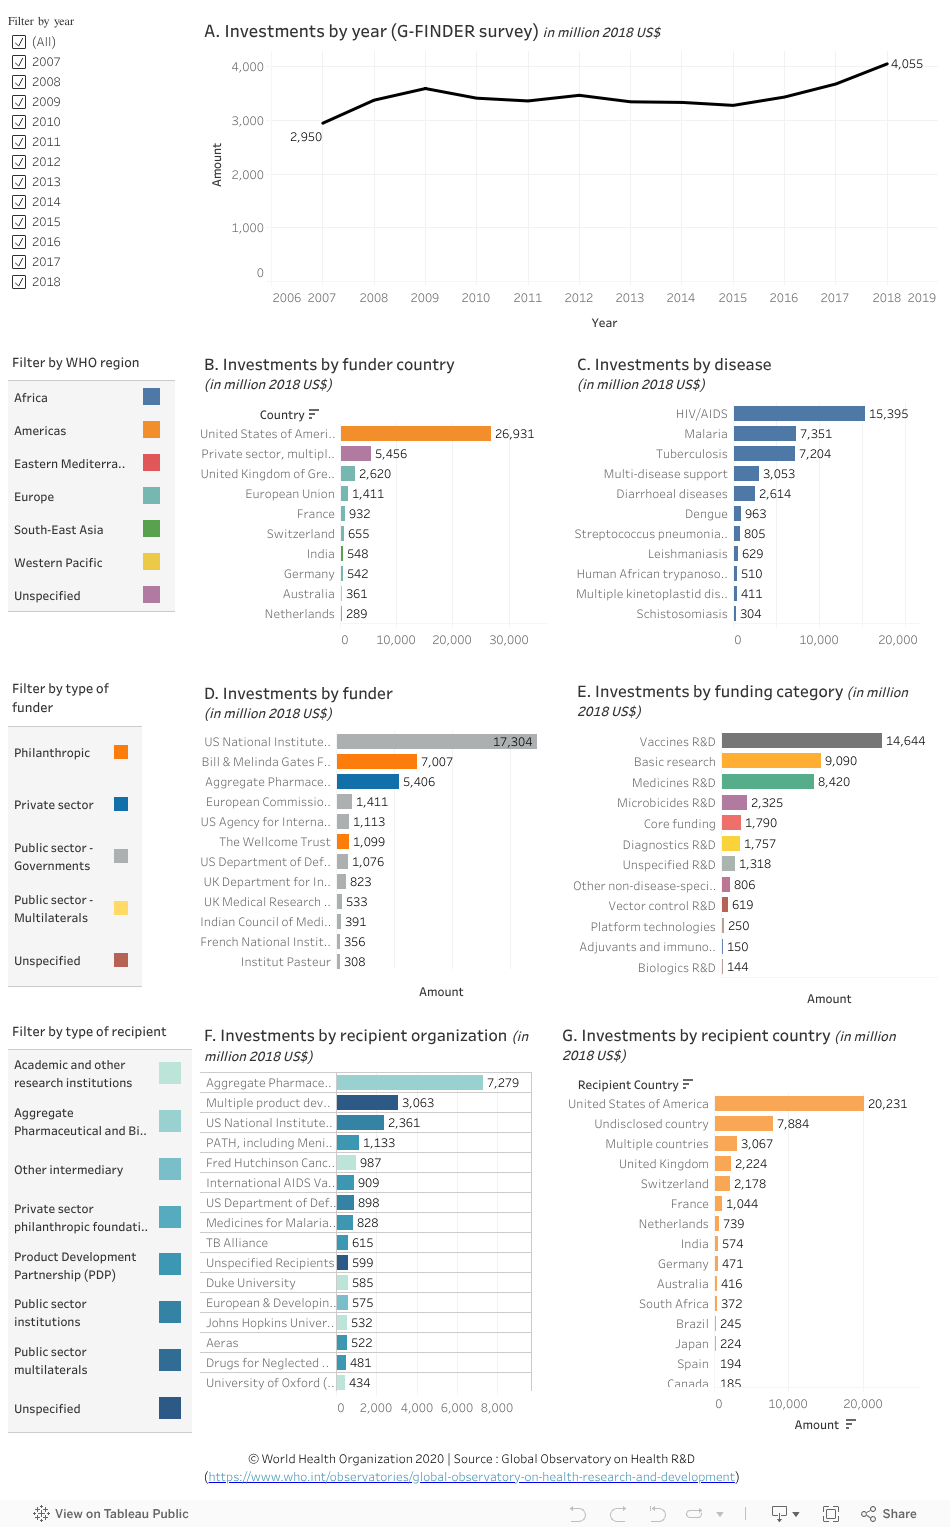
The data visualization illustrates the trend in investments for neglected diseases from 2007 to 2018 (chart A), their distribution by funder country (chart B), disease (chart C), funder organization (chart D), funding category (chart E), recipient organization (chart F) and recipient country (chart G). All funding data have been adjusted for inflation, and are reported in 2018 US dollars (US$) (adjustment performed by the data source).
Data can be filtered by year, WHO Region, type of funder or type of recipients by selecting the relevant category (or more than one) from the tick-box or legend key on the left side of the charts.
Points to note:
- The G-Finder survey data underestimate the total R&D investments for these diseases as reporting is incomplete and needs to be interpreted cautiously due to the scope restrictions of the survey. In addition, due to a change of scope of the G-FINDER survey for this round of analysis, change in the overall funding and that of particular diseases need to take these modifications into account (see “scope and limitations” below).
- The reported funding flows by country exclude investments by the private sector, which is reported separately in an aggregate form (referred to as “private sector, multiple countries” in the country list). Therefore, the total investments by country only represent public and philanthropic sources in those countries.
- Over the 12 years of investments on R&D for neglected diseases (2007-2018):
-- The United States of America contributed almost two thirds (US$ 26.93 billion) of the total investments on neglected diseases from public and philanthropic sources, followed (aside from the private sector) by the United Kingdom of Great Britain and Northern Ireland (US$ 2.62 billion) (chart B). Investments by the private sector (referred to as “private sector, multiple countries” on the country list) were a total of US$ 5.46 billion (chart B). Each of those three top funders increased their investments for the fourth year since 2015. Another notable increase came from Japan (+ 82%, +US$ 15 million) between 2017 and 2018, which has continued to increase its investments since 2012 (select each country of interest in chart B and view the trend line in chart A).
-- HIV/AIDS continued to receive the highest investments, followed by malaria and tuberculosis (US$ 15.40, 7.35, and 7.20 billion respectively) with the majority of the investments coming from the United States of America ( 83.09%, 57.50%, 58.17% for each disease respectively) ( select each disease of interest in chart C and view the top bar in chart B).
-- Investments by the private sector (select “private sector” in the left-side filter by funder type) have increased since 2012 (chart A), with tuberculosis (US$ 1.45 billion), malaria (US$ 1.42 billion) and HIV/AIDS (US$ 0.77billion) constituting the top three diseases they target. However, the highest increases between 2017 and 2018 are outside the top three diseases, with hepatitis C, human african trypanosomiasis and Chagas disease (select each disease of interest in chart C and view the trend line in chart A).
-- Across all diseases, the top funder was in the public sector (i.e. the United States of America’s National Institutes of Health [NIH]), followed by a philanthropic organization, (the Bill & Melinda Gates Foundation) and the private sector (aggregate pharmaceutical and biotechnology companies), with US$ 17.30 billion, US$ 7.01 billion and US$ 5.41 billion investments respectively (chart D). Together they account for more than 70% of all investments in R&D for neglected diseases (hold the Ctrl key and select the first three bars in chart B to display their total investments in chart A). Investment from the public sector-multiraterals category reported a record high with US$ 75 million in 2018, with almost 98% of the funding coming from the Unitaid. (select “public sector-multilaterals” in the left-side filter by funder type, then select 2018 on the trend line in chart A and view chart D).
-- Among the recipient organizations, the United States of America’s National Institutes of Health [NIH] (Public sector)) and PATH (product development partnership) received the third and fourth highest amount of investments after the private sector and a group of multiple product developers of unspecified affiliation (chart F).
-- Overall, almost 50% of all recipient organizations were located in the United States of America (Chart G).
Scope and limitations
The data must be interpreted cautiously because of the specific scope restrictions of the G-FINDER survey (see link below for detail). The scope of the G-FINDER survey is determined by applying the following three criteria for neglected diseases (R&D investments which do not meet these criteria are excluded).
- The disease disproportionately affects people in developing countries.
- There is a need for new products (i.e. there is either no existing product or improved or additional products are needed).
- There is market failure in developing these new products (i.e. there is an insufficient commercial market to attract R&D by private industry).
In addition, the funding data from industry is available in an aggregated form. This means that funding levels by funder, funding category and other breakdowns substantially underestimate the actual investments in these categories since data by the private sector (pharmaceutical and biotechnology companies) are presented separately within the scope of G-FINDER and in the data visualization above.
Note that this latest data visualization does not contain data for R&D funding for Ebola and other viral haemorrhagic fevers (contained in the visualization published by the Observatory in July 2017) as the data for these have not yet been updated yet by G-FINDER. A separate G-FINDER report focusing on emerging infectious diseases (EIDs) identified in the WHO R&D Blueprint will address these; its data will be visualized and provided in the Observatory once available.
For this year’s analysis, the scope of the G-FINDER survey was modified as followed:
- Additions:
-- Hepatitis B: basic research, medicines, biologics, and diagnostics
-- Mycetoma: Basic research, medicines, and diagnostics
-- Snakebite envenoming: Basic research, medicines, biologics, and diagnostics Expansions:
-- Hepatitis C now includes all virus genotypes (rather than only genotypes 4, 5 & 6), although restrictions to ensure that R&D is targeted at LMICs remain.
-- The scope for leprosy was expanded to include vaccine development.
-- A new category called “biologics” now consolidates funding that was previously included under therapeutic vaccines, drugs, and preventive vaccines.
To explore the data further
- Filter data by year, WHO region, type of funder or type of recipient by selecting the relevant category (or more than one) from the tick-box or legend key on the left side of the visualization.
- Click on a bar or point on a line graph to filter data for the desired selection.
-- For example, click on a disease name in chart C to display the respective annual trend in investments in chart A and other specific information for that disease in the other charts. - Hover the cursor over the line on chart A or on a bar in a graphic to see more information in a popup window.
- Undo a selection by clicking ‘undo’ or ‘reset’ near the bottom of the page or by clicking the same element again.