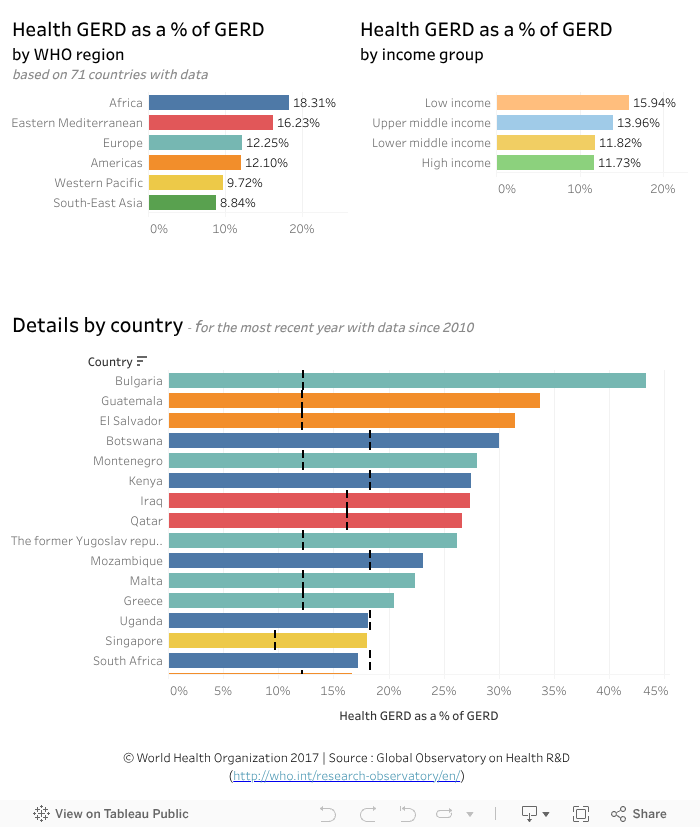
Gross domestic R&D expenditure on health (health GERD) as a % of total GERD
Published: January 2017
The gross domestic expenditure on R&D (GERD) and GERD in the health and medical sciences (health GERD) are collected from the United Nations Educational, Scientific and Cultural Organization (UNESCO) and are reported below using the most recent available data since 2010 by country. (Note: not all countries have reported data on this indicator.)
See also:
What you see
The data visualization compares health GERD by country as a % of total GERD. Regional weighted averages are provided by WHO region and country income groups (top charts).
Points to note:
- The weighted regional averages are derived from the 71 Member States for which data are available. They need to be interpreted cautiously because of the number of missing observations.
- The regional average health GERD as % of total GERD varies between 9% (South-East Asia) and 18% (Africa). (Top left.)
- Low income group countries allocated the highest % of their GERD to health, on average – 16% compared to 12% by high income countries. (Top right.)
To explore by country estimates and differences with regional averages (in the chart at the bottom -- regional average symbolized by vertical dashed bar):
- Select a region and/or income group in the top charts to filter countries according to those categories.
-- For example, selecting Africa (in the top left chart) only, shows that Botswana, Kenya and Mozambique allocated higher % of GERD to health (23%–30%) than the regional average (18%). The three countries have also allocated amounts above the average within their income group. - After selecting a region, you can select an income group (in the top right chart) which will filter the countries belonging to this income group within this region.
-- For example, selecting low income countries within Africa (already selected in the previous step) shows that Mozambique (among five other countries in that income group) is the only one exceeding the regional average. Mozambique and Uganda are both above the average for that income group. - Hover the cursor on a bar in a graphic to see more information in a popup window (year, total GERD in local currency, health GERD in local currency, health GERD as % of total GERD, regional/income level averages).
- Undo the selection by selecting ‘undo’ or ‘reset’ near the bottom of the visualization or by selecting the same element again.