Vaccines in tropics and subtropics
Over the last decade an increasing number of low and middle income countries situated in the tropics and subtropics have considered introducing or expanding seasonal influenza vaccination in their national immunization program.
Due to the complexities of seasonal influenza activity in tropics and subtropics e.g., multiple peaks and identifiable year-round activity, two challenging questions to these countries are when to vaccinate and which formulation (northern or southern hemisphere) to use.
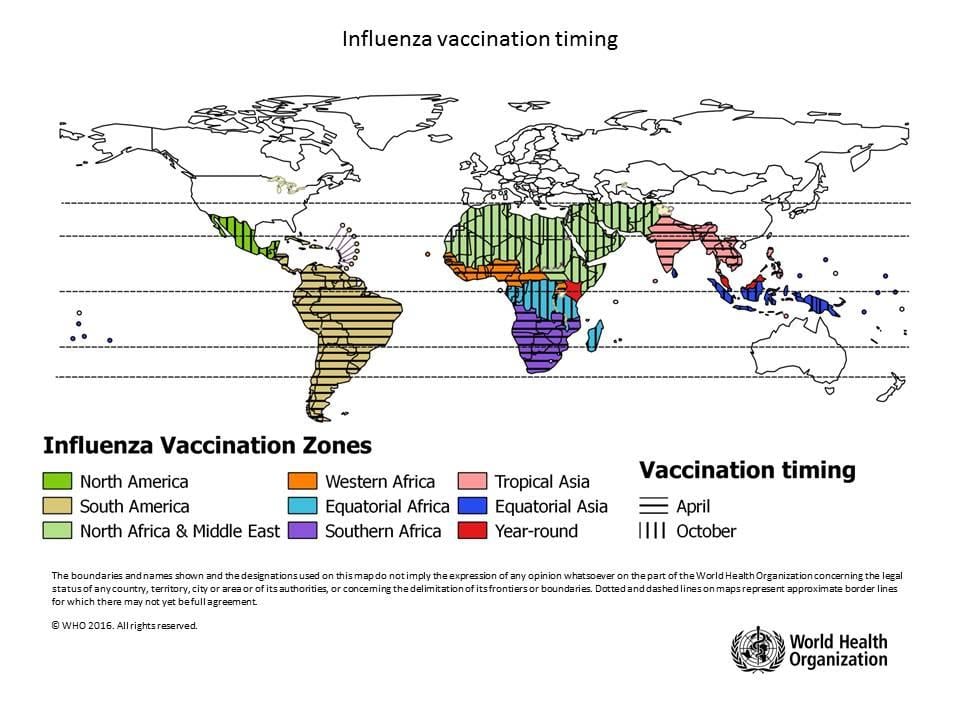
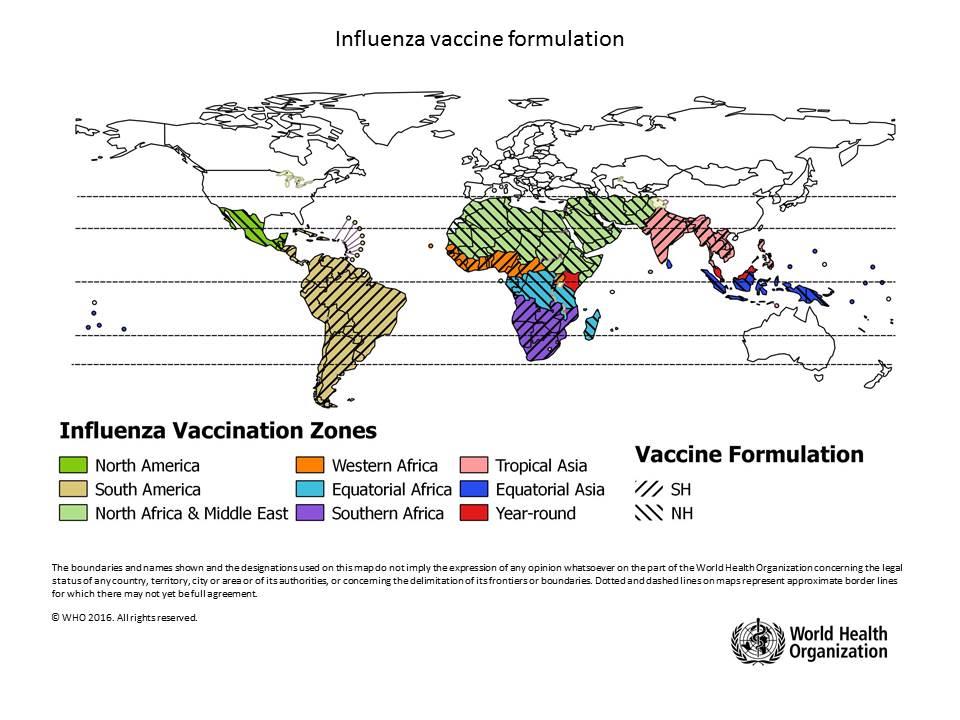
The WHO Global Influenza Program recommends an evidence-based practical approach to group countries that share the same seasonality pattern and virus antigenic characteristics, into Influenza Vaccination Zones to address the country needs.
Vaccination timing
Based on the start of the primary influenza activity period, countries are assigned to two categories:
- countries where the primary influenza activity starts after October, and,
- countries where the primary influenza activity starts after April.
In order to be most effective in countries with multiple peaks and residual year-round activity, WHO recommends that the seasonal influenza vaccine should be given prior to the start of the primary period of increased influenza activity.
Countries are encouraged to analyse local surveillance information to assess their seasonality pattern at both national and sub-national level as appropriate to make evidence-based decisions on timing of vaccination campaigns.
Seasonality in the Tropics and Subtropics
Seasonality (number of peaks, period and start and end month of increased influenza activity) was assessed by different analytic approaches using FluNet and national influenza surveillance data for 70 of the 138 countries representing about 73% of the world’s population.
Discordance in the assessment of the number of peaks or where the start of the season differed by more than one month was seen in 29 countries. Consensus on seasonality pattern was reached through discussions among the researchers and in-country experts by combining both the raw output of the individual methods and knowledge of the strength of the data to determine outliers.
Which vaccine formulation to use – Northern or Southern Hemisphere?
From an antigenic evolution perspective, there is no evidence to suggest the need for a 3rd recommendation for vaccine composition specifically for the tropics and subtropics, and the most recent WHO influenza virus vaccine recommendation should be used, independent of the hemisphere in which the country is situated.
Countries are encourage to strengthen surveillance and share viruses with WHO Collaborating Centers of Global Influenza Surveillance and Response System for analysis of antigenic and genetic similarity with both the NH and SH vaccine formulation of the respective season, to determine which vaccine formulation has a better antigenic correspondence with currently circulating viruses.
Virus evolution in the tropics and subtropics
A cartographic time-series analysis of antigenic evolution of the influenza A(H3N2) virus isolated between 2002 to 2006 in Thailand and a similar analysis for influenza B/Yamagata and B/Victoria lineage viruses from 17 other countries in the tropics and subtropics showed no substantial differences from the global patterns of antigenic evolution.

Figure: Time series showing the antigenic evolution of human seasonal A/H3N2 viruses isolated from Thailand and from the rest of the world. Red dots indicate viruses isolated in Thailand in particular 3-month period, in subsequent figures red dots become light blue to indicate the antigenic history of the red dots. Grey dots indicate viruses isolated elsewhere in the world and also remain in subsequent figures to show the antigenic history of the grey dots. Time series runs from Q2 2002 to Q4 2006. Blue dots indicate vaccine viruses, which from top to bottom are A/Moscow/10/1999, A/Fujian/411/2002, A/Wellington/1/2004, A/California/7/2004, A/Wisconsin/67/2005, and A/Brisbane/10/2007 (Data source: GISRS, Analytics, Cambridge University)
Related publications


